
Data-Driven Decision Making in Production
Data-Driven Decision Making means basing a decision on a number whose meaning, timeliness, and ownership are all clear. The hard part isn’t the dashboard. It comes before that: the same metric must mean the same thing in every department, and it must be available before the decision is due. If either is missing, you don’t get a better judgment — just a longer discussion about the number.
Definition: Data-Driven Decision Making
Data-Driven Decision Making
means decisions that rely on measured values rather than second-hand reports or individual experience. In production, these values exist in abundance: every controller, every sensor, every SCADA system is constantly recording.
It’s rarely access to data that’s the problem. It fails at three points before that: the number means something different in two systems, it’s older than the decision, or nobody is responsible when it goes off track. A dashboard fixes none of these three points — it only makes them more visible.
So the sober yardstick isn’t “How many metrics do we display?” but: Which decision gets made differently today than before — and how much earlier?
Why the same question has three answers
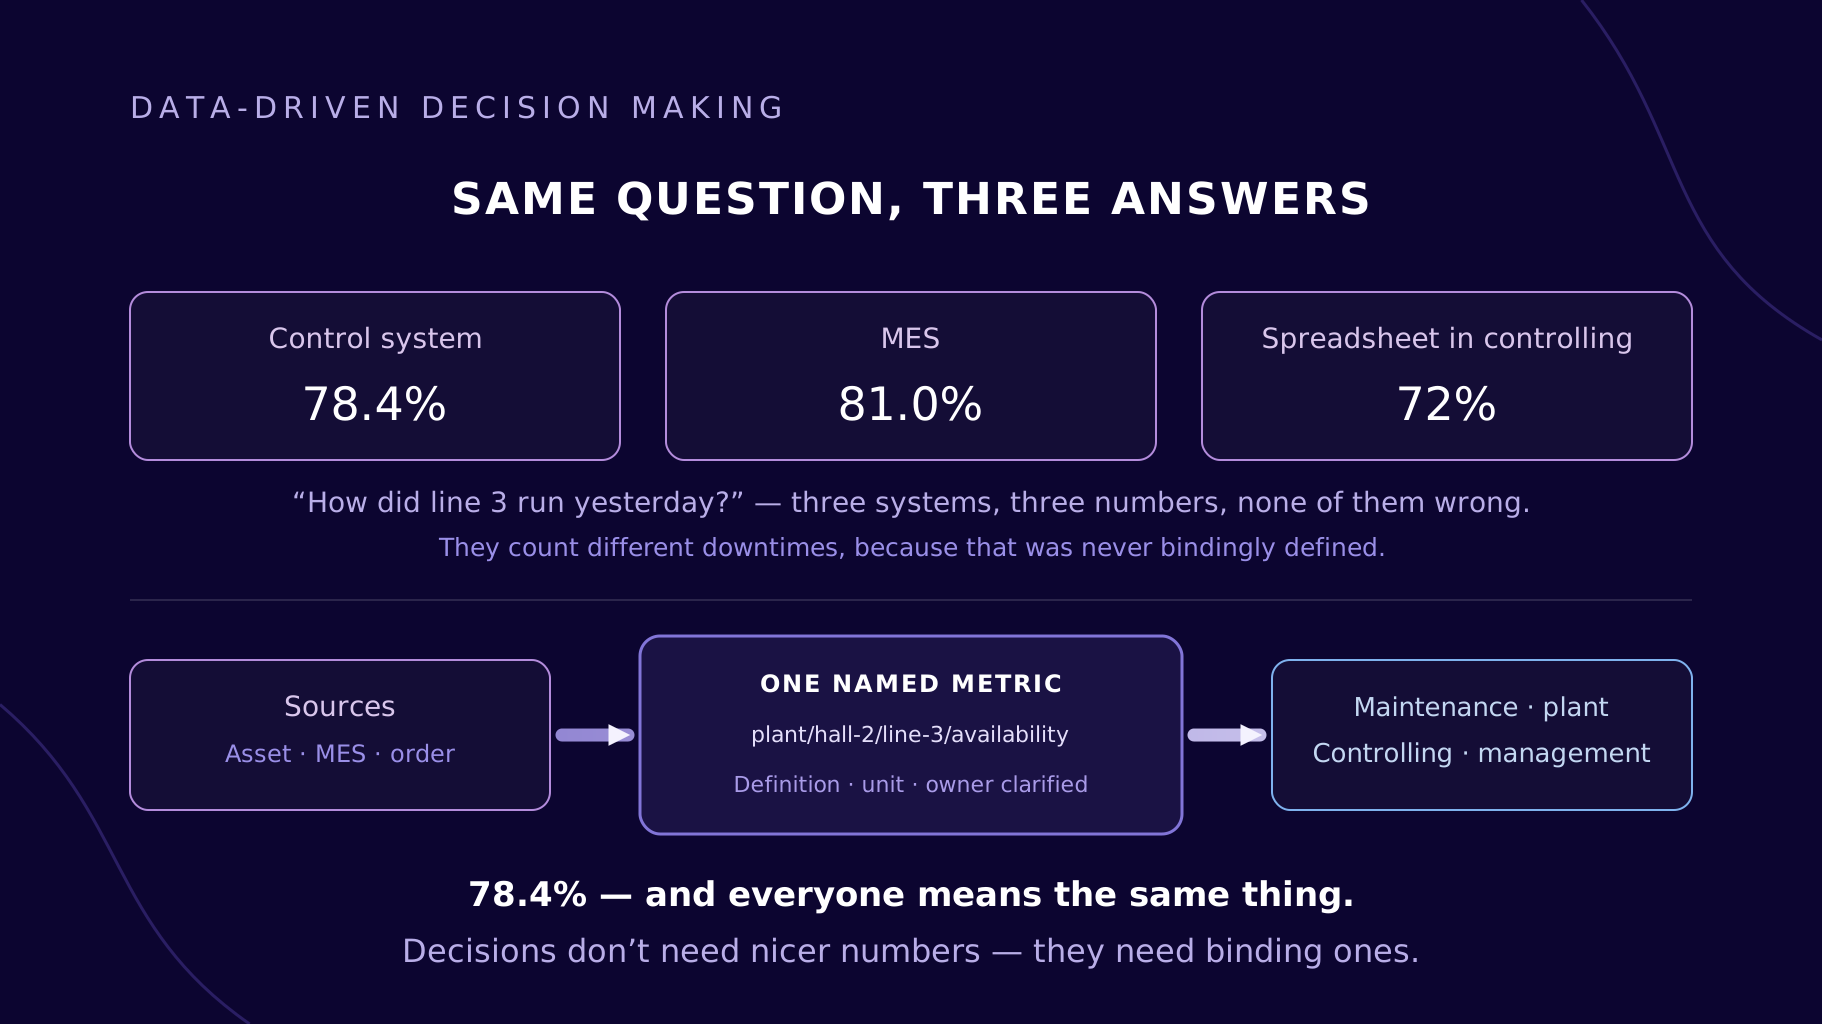
“How did Line 3 run yesterday?” isn’t a question with one answer in many plants.
The SCADA system calculates availability against planned runtime, the MES doesn’t count changeover time as downtime, and controlling has a spreadsheet someone built once. All three numbers are calculated correctly. What differs are the definitions.
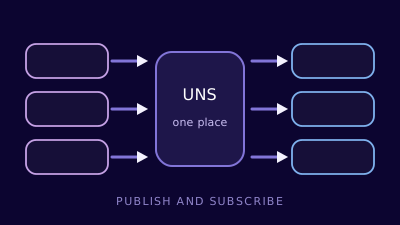
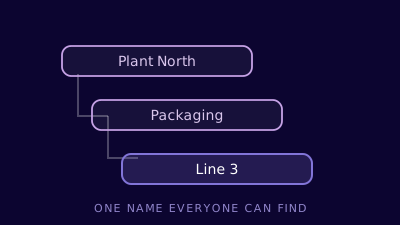
This isn’t a data problem, it’s a naming problem. It only gets resolved once a metric is defined once — with a definition, a unit, and an owner — and every consumer pulls it from exactly that place. That’s exactly what a Unified Namespace does: it’s the place where many numbers become one.
The first fifteen minutes of a meeting go to the question of which number is right. As long as that’s the case, it’s not the data that decides — it’s whoever can outlast the discussion.
The delay and its parts
Between an event in the plant and a resulting action there are always five steps: capture, classification, view, assessment, action. This stretch is the real metric of decision-making capability — not the number of reports.
Where analyses are freshly built for every question, the longest part isn’t the technology but the waiting: for the next reporting cycle, for someone to compile the data, for clarity on which version is valid. Where the structure already exists and the value flows continuously, exactly these steps disappear.
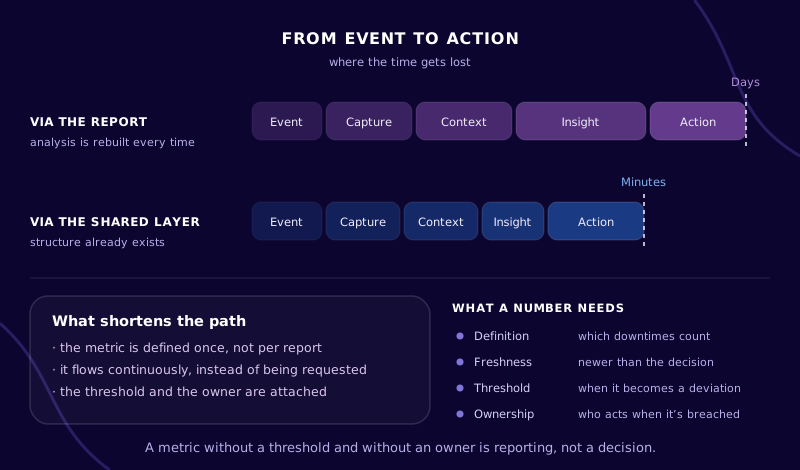
The same five stations, two paths — the difference lies in what doesn’t have to be rebuilt every time.
What matters is the direction, not the record: a decision made once a quarter doesn’t need second-by-second values. A changeover decision in an ongoing shift does.
Four prerequisites
A number is fit for a decision when it satisfies all four criteria. Three out of four aren’t enough
— the missing one determines what happens in the end.
-
The value arises automatically
It’s captured, not entered by hand. Handwritten logs age between two shifts and end up documenting the diligence of whoever recorded them more than the process itself.
-
The meaning is fixed
Definition, unit, and reference quantity are fixed and apply identically in every system. Only then is a comparison between two lines or two plants valid.
-
The value is newer than the decision
Not “real time,” but fast enough for the cadence at which decisions are made. The yardstick comes from the process, not from the technology.
-
Threshold and owner are defined alongside it
At what point does a deviation become a deviation, and who acts then? Without these two pieces of information, a metric is reporting, not a decision.
Which decision needs which timeliness
The most common mistake is wanting to make everything equally fast. The sensible order is the reverse: first clarify at what cadence decisions get made, then design the data pipeline around that.
| Decision level | Example | Timeliness needed | What usually fails |
|---|---|---|---|
| Equipment | adjust a parameter, stop the equipment | seconds | already handled in the controller — no platform needed here |
| Shift | change over, prioritize an order, call maintenance | minutes | the value exists in the plant but not where the decision is made |
| Plant | daily planning, staffing, material requests | hours | every line counts differently, a comparison isn’t valid |
| Enterprise | investment, site comparison, supplier choice | days to weeks | the history isn’t consistently named, retrospectives are estimates |
The last column is telling: on no level is missing measurement technology the reason.
It’s the structure in between, every time. Why that’s an architecture question
What a feedback loop really requires
The benefit of data-driven decisions only shows once the effect of the same action is measured — with the same metric, before and after the change. That sounds obvious and regularly fails because the definition was adjusted in the meantime. Anyone who wants to evaluate changes therefore needs not just a named metric, but a stable one: the content can be flexible, the ordering principle can’t.
Where data doesn’t decide
Data-driven doesn’t mean data-controlled. Three limits remain, and naming them makes the approach more robust:
- No number resolves a trade-off. Throughput versus changeover time, inventory versus delivery reliability, deadline versus maintenance — these are trade-offs. Data makes the cost of each option visible; the weighting remains a management decision.
- What isn’t measured disappears from the debate. Startup behavior, individual operators’ experience, the condition of an old machine — anyone who only evaluates what’s captured decides systematically around it.
- A metric that controls gets optimized. As soon as behavior is measured against a number, it shifts in that number’s direction — even when that hurts the actual goal. That’s why every controlling metric needs a counter-metric.
And one practical limit: deviations that become visible early only help if they reach someone who is allowed to act. A notification without a mandate creates busywork, not a correction.
How pronubes delivers the data foundation
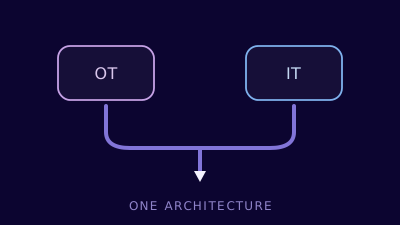
pronubes is the layer between the shop floor and IT. For decisions, three parts of it are decisive:
- pronubes Edge captures values locally at the plant via OPC UA, MQTT, REST, SQL, and file formats — and buffers if the connection fails. That means no gaps that later get misread as anomalies.
- pronubes Zones provides the structure in which a value unambiguously belongs to a site, area, and unit. This is the layer where three numbers become one.
- pronubes Insights shows which source delivered what and when — including the flows that go silent. A metric whose source has been stalled for two days looks like good news on a dashboard.
From there, the values can be passed on to analytics systems, dashboards, and a data lake — without every target system needing its own connections to the equipment. More about the platform
- Data-Driven Decision Making
- Decisions based on measured, named, and current values rather than second-hand reports.
- Decision latency
- The time between an event and the resulting action — including capture, classification, view, and assessment.
- Single Source of Truth
- A defined place where the valid state of a metric lives; all other systems read from there instead of keeping their own versions.
- Metric (KPI)
- A measured quantity with a fixed definition, unit, threshold, and owner. Without a threshold or owner, it’s a display, not a metric.
- Counter-metric
- A second measured quantity that reveals whether a metric was improved at the expense of another goal.
- Closed loop
- The closed path from measurement through decision back to the setpoint in the equipment.
- Unified Namespace
- A uniformly named, hierarchical structure in which sources publish their current state and consumers subscribe to it.
Frequently asked questions
Do we first need a data warehouse or a data lake for this?
Not as a first step. A store doesn’t solve the naming question — it just collects it. If you store ambiguous values, you end up with more ambiguous values. The sensible order is: name your metrics, capture them continuously, then decide what to store permanently and for what purpose.
At what point is data “good enough” for a decision?
When the remaining uncertainty is smaller than the difference between the options for action. That’s rarely a question of more decimal places, usually a question of gaps: if whole time periods or pieces of equipment are missing, even an exact average is worthless.
How do we prevent metrics from steering in the wrong direction?
Every controlling metric gets a counter-metric: throughput alongside scrap, availability alongside maintenance effort, inventory coverage alongside delivery reliability. And both get reported together, not in separate rounds.
Who owns a metric — the business department or IT?
The definition belongs to the business department that decides with it. IT is responsible for keeping it technically available, complete, and traceable. What matters is that this division is made explicitly and recorded in the structure — a metric without a named owner quietly decays.
Does this replace the experience of people in production?
No, it relieves them. Experience is most valuable for the question of why a value deviates and which action works on this particular piece of equipment. Where experience is mostly spent today reconciling contradictory numbers, it’s being used poorly.
Does production have to stop for this?
Usually not. Capture happens read-only via existing interfaces. A downtime window only becomes necessary when something needs to change on the controller itself — that’s the exception.
Decisions built on real data.
30 minutes about your system landscape: which data is missing today and how to make it usable day to day.
pronubes is a product of inray Industriesoftware GmbH. Over 30 years of industrial software from Germany. Innovative and reliable for manufacturing companies.