
ROI (return on investment) relates the benefit of an investment to its cost: (benefit − cost) ÷ cost. For investments in production data, it stands or falls with two things: a measured baseline and an honest cost calculation over the whole lifetime. It is a decision aid, not a guarantee. ROI stands for “return on investment”. The basic formula is: (benefit − cost) ÷ cost. If the calculation gives 0.6, that is an ROI of 60 percent. The measure answers how much benefit each euro invested produces. It does not answer everything. When the benefit arises and how costs are spread over the years stays invisible. That is why ROI is usually combined with other measures. The origin lies at DuPont. In 1914, Donaldson Brown, then Assistant Treasurer, developed a formula there that combined earnings, working capital and investment in plant into one measure, and called it “return on investment”. According to the Hagley Museum, DuPont made ROI its main performance measure and required an ROI forecast with every capital request. The calculation is quick. Purely as an illustration: an investment of EUR 250,000 is expected to bring a benefit of EUR 400,000 over three years. The ROI is (400,000 − 250,000) ÷ 250,000 = 0.6, so 60 percent. The figures are a worked example, not a figure from experience. What matters is that every assumption behind it is named and can be checked. With production data, the benefit can often be tied to plant measures. The overview lists typical building blocks on both sides of the calculation. Four points decide whether an ROI calculation is robust. The sequence has proved its worth because it makes assumptions visible early. Capture availability, performance and quality of the affected plants over a representative period. Define which measure should improve by how much through the intervention, and record the reasoning. Include introduction, operation and maintenance, not only the purchase. Test the hypothesis on one plant or line, compare with the baseline and only then extrapolate. Four distinctions prevent typical misjudgments. The hurdles mostly lie in the data and the organization, rarely in the formula. The ROI of a data platform cannot be derived from a product description. It depends on your plants, your baseline and your costs. pronubes therefore names no guaranteed values and makes no general ROI promise. We help create the measurement basis on which you can calculate your own ROI. pronubes provides the data basis on which benefit can be demonstrated at all. The product parts take on different tasks. With the formula (benefit − cost) ÷ cost. With costs of EUR 250,000 and a benefit of EUR 400,000, the result is (400,000 − 250,000) ÷ 250,000 = 0.6, so 60 percent. The values come from a worked example. That cannot be said in general. It depends on your minimum required return, on risk and on alternatives. Compare ROI with other investments and also check payback period and net present value. It says nothing about when the benefit arises. Two investments with the same ROI can differ considerably in timing and risk. That is why payback period and net present value are added. Through plant measures such as availability, performance and quality, which come together in OEE. A measured baseline before the intervention is a prerequisite. In 1914, Donaldson Brown developed a formula at DuPont that he called “return on investment”. DuPont used it as its central performance measure and required an ROI forecast with capital requests. pronubes creates this data basis: capture machine data, structure it and keep it in view in operation.How is the ROI of an investment in production data calculated?
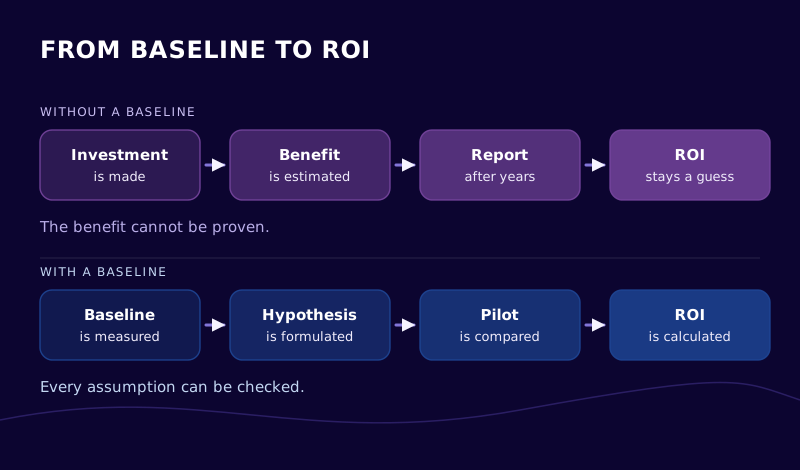
Definition: ROI
Measure
Question
Limit
ROI
How much benefit does each euro invested produce?
Does not consider when the benefit arises
Payback period
When have the costs flowed back?
Ignores benefit after payback
Net present value
What are future payments worth today?
Needs an interest rate and reliable forecasts
Life cycle cost
What does the solution cost over its whole lifetime?
Says nothing about benefit
Why the measure is so widespread
What benefit and cost are made of
Building block
Effect on the calculation
Source
Availability
Less unplanned downtime raises productive run time; first OEE factor
Nakajima, 1982; ISO 22400-2
Performance
Running speed relative to theoretical maximum speed; second OEE factor
Nakajima, 1982; ISO 22400-2
Quality
Share of products that meet requirements on the first pass; third OEE factor
Nakajima, 1982; ISO 22400-2
Life cycle costs
Purchase, introduction, operation and maintenance belong on the cost side
IEC 60300-3-3, 2017
What the calculation depends on
Four steps to an ROI calculation
Measure the baseline
Formulate benefit hypotheses
Capture costs over the lifetime
Verify in a pilot
What ROI is not
Typical hurdles in practice
How pronubes helps
Frequently asked questions
How is ROI calculated?
When is an ROI “good”?
Why is ROI alone not enough?
How can the benefit of production data be measured?
Where does the term ROI come from?
A robust ROI starts with data you can compare before and after the intervention.
pronubes is a product of inray Industriesoftware GmbH. Over 30 years of industrial software from Germany. Innovative and reliable for manufacturing companies.